In this module we’ll cover useful debugging tools that you should know how to use as a hybrid app developer. There are many options for debugging your apps regardless of how you’re running your app; on device/emulator, in the browser or in the PhoneGap Developer App.
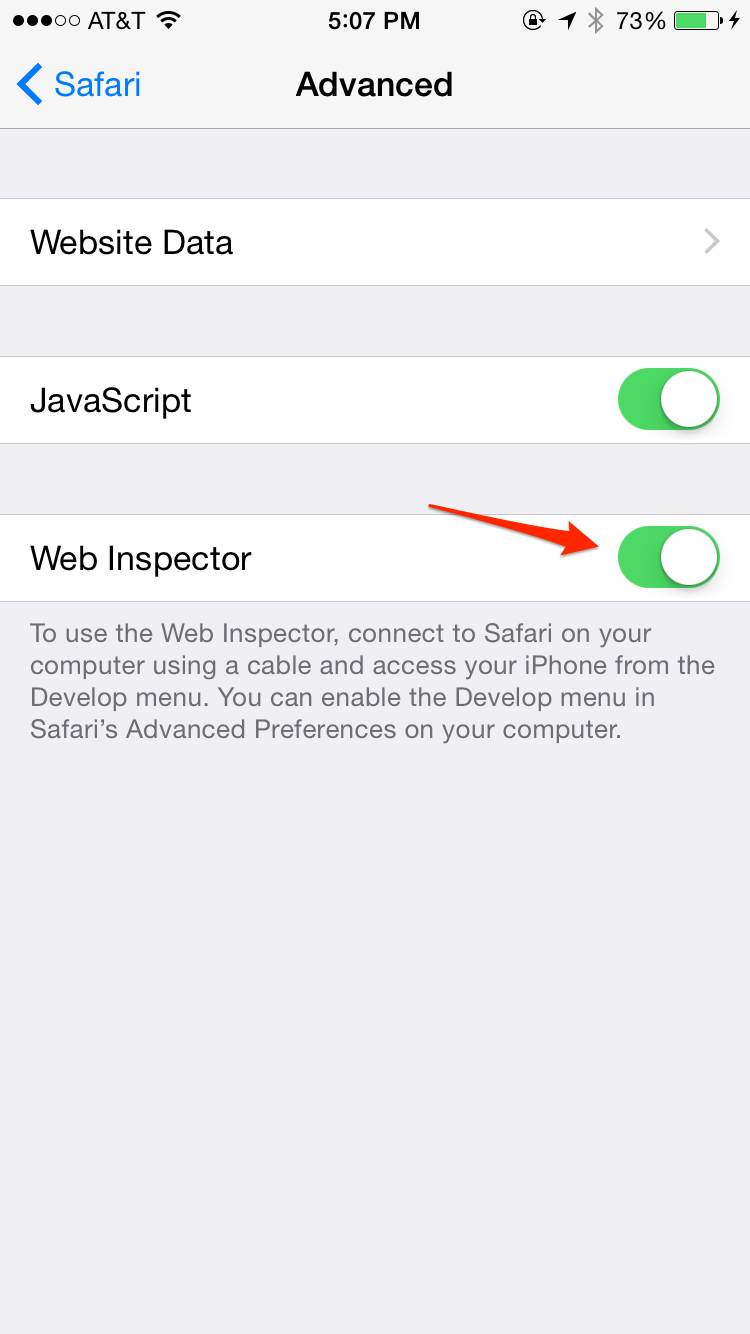
This feature was introduced in iOS6 and allows you to use the Safari web browser to debug web applications running on iOS devices, and this includes PhoneGap apps.
You can remote debug a PhoneGap application running on a simulator if you don’t have a device handy for testing. If you’re using the PhoneGap CLI in particular, ensure to install ios-sim to easily launch and simulate your apps on iOS.</div>
Run the mobile PhoneGap application you want to debug on your device or simulator from the CLI
  $ phonegap run ios
  $ phonegap run ios --emulator
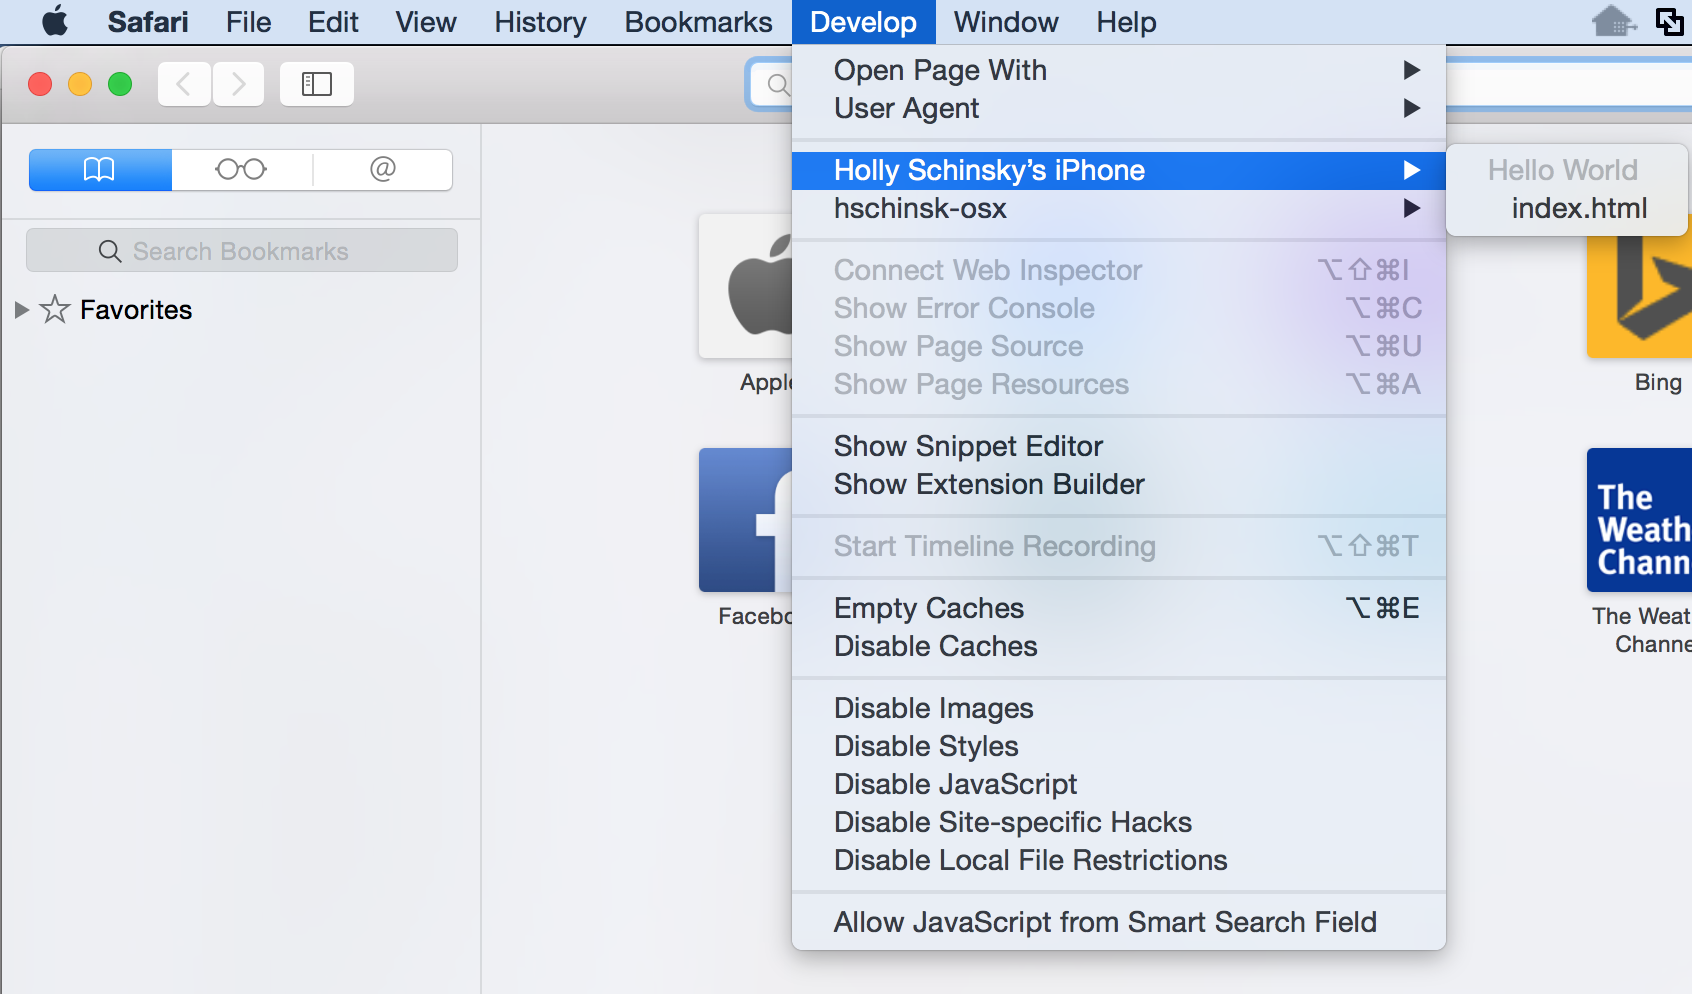
Open the newly enabled Develop menu in Safari and locate the name of your connected device in the drop down:
You can remotely debug your Android applications running on your device in a similar way to the above using Chrome. Follow the steps below to get started.
Connect your Android Device to your computer via USB
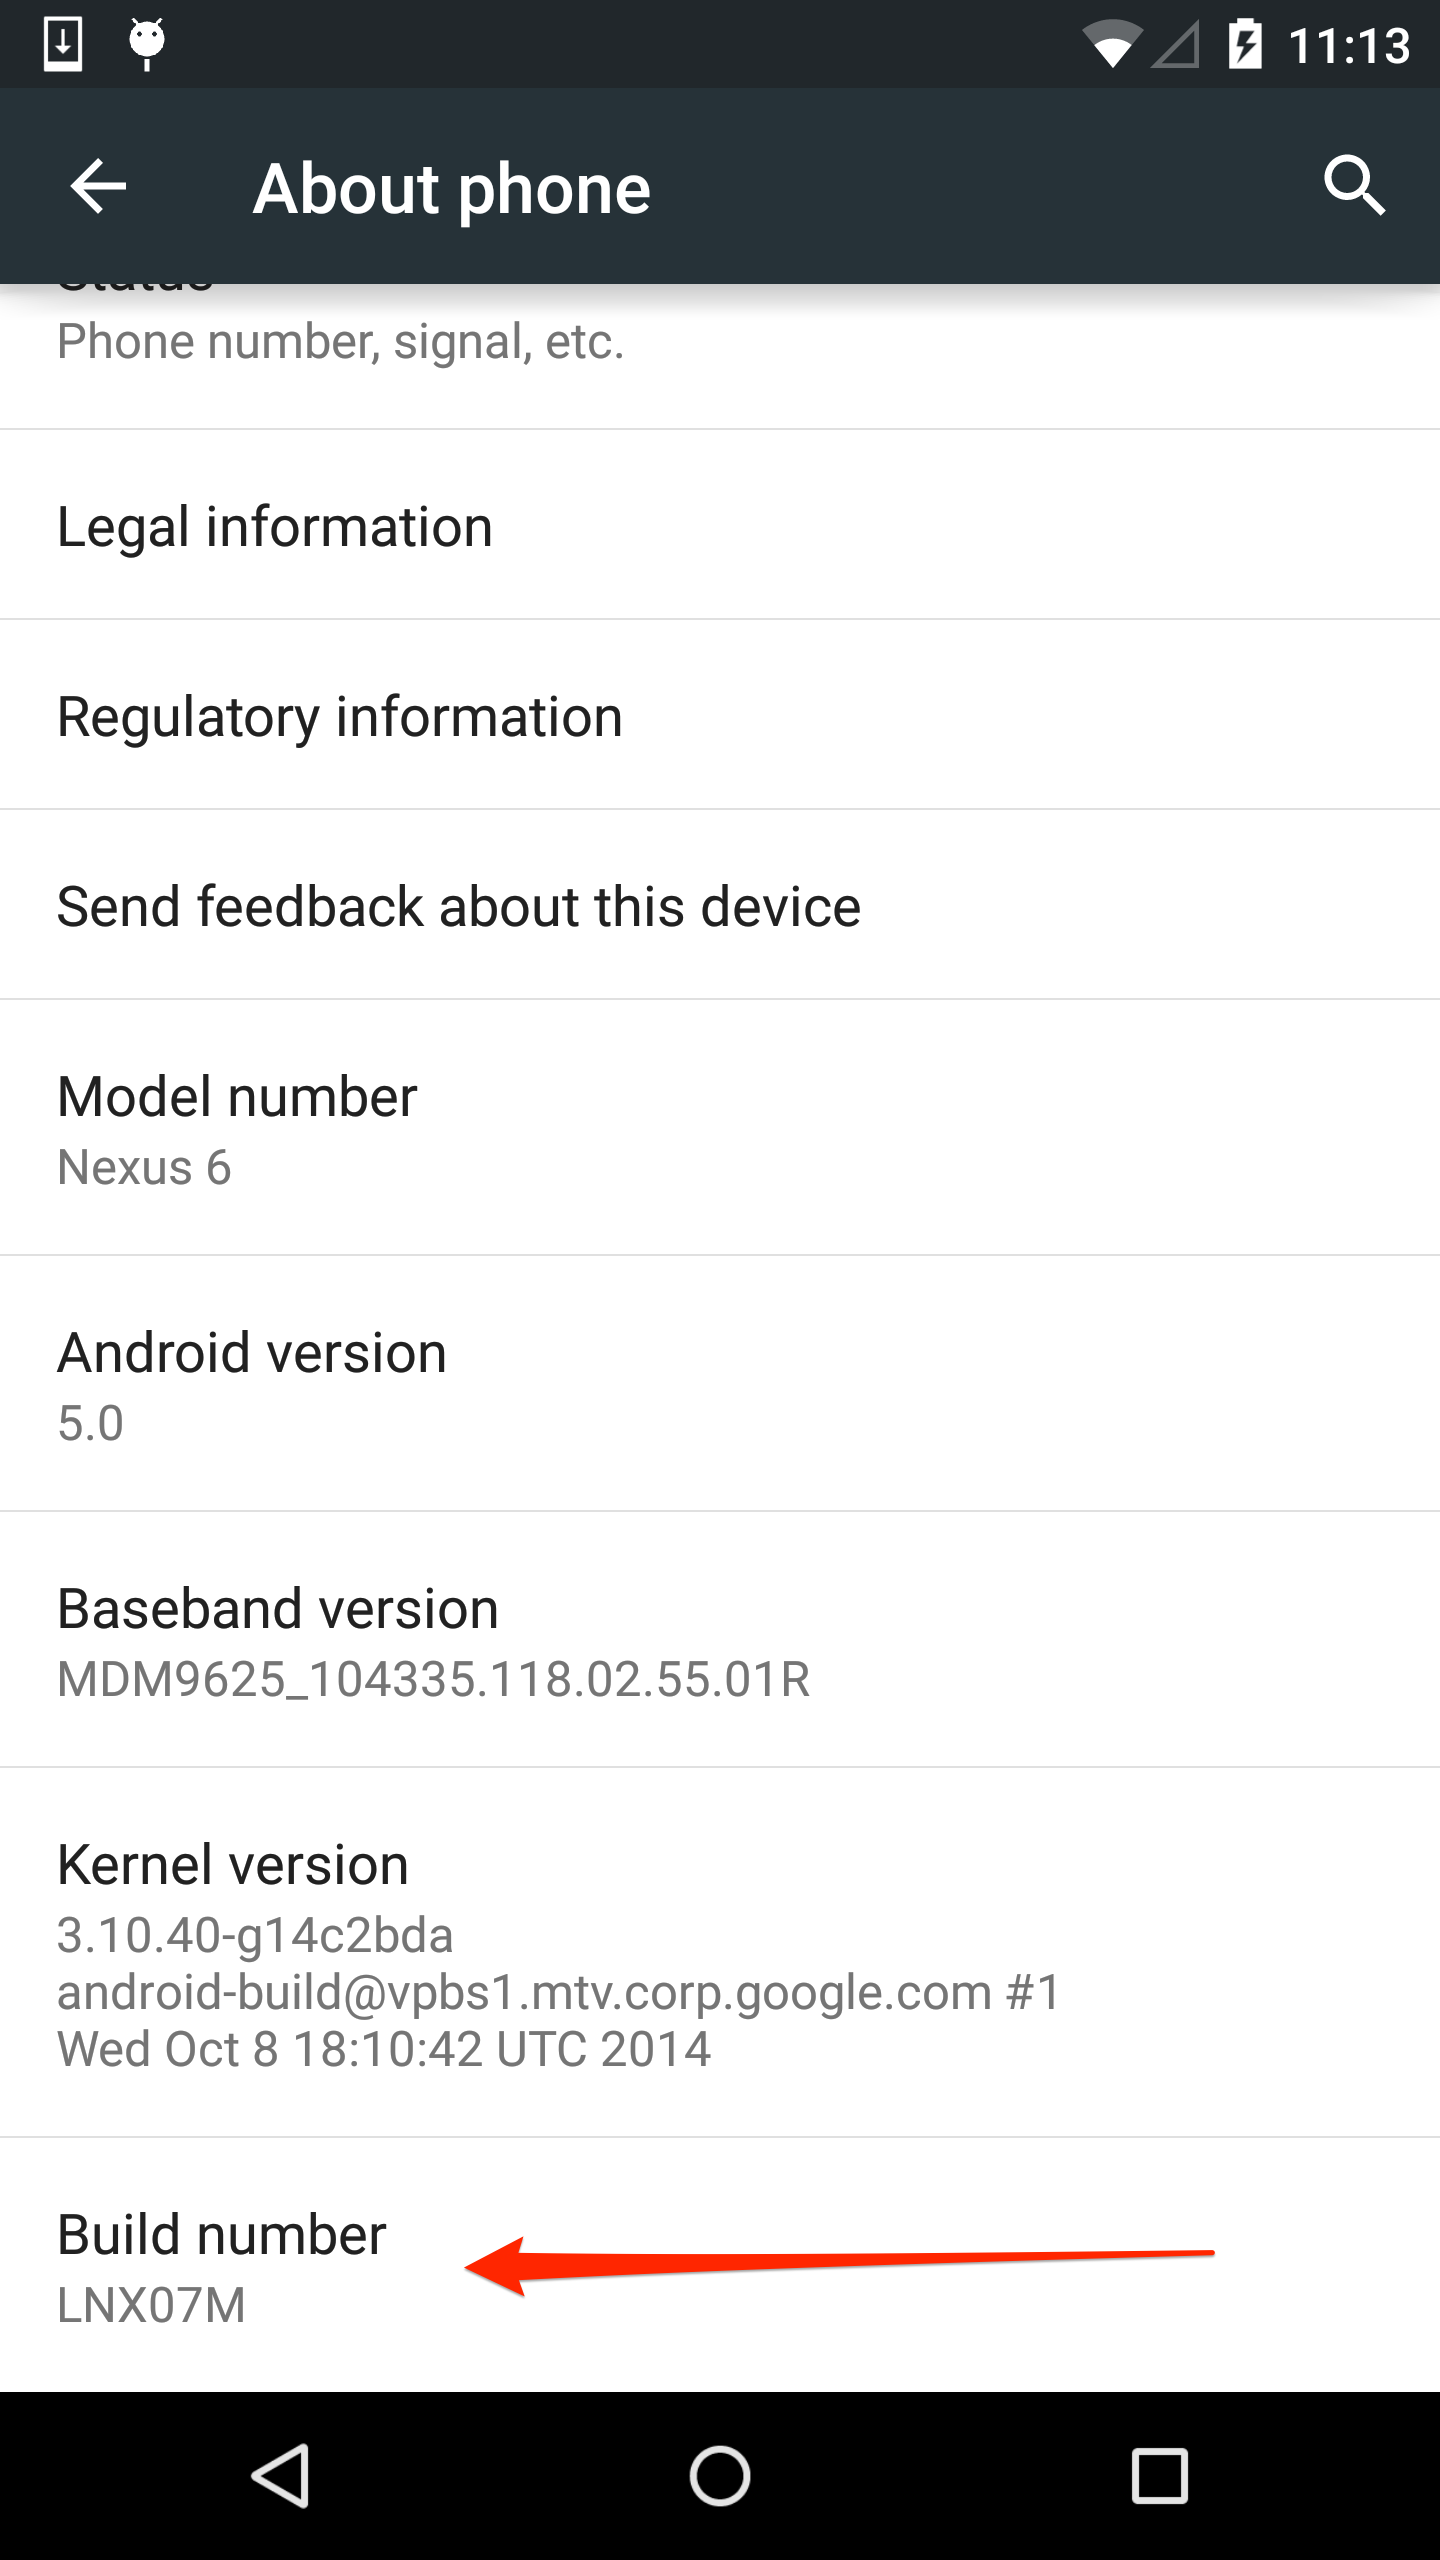
Enable Developer mode on your device - from your Android device, open up Settings and scroll down to About phone, scroll down to the Build number and tap on it 7 times:
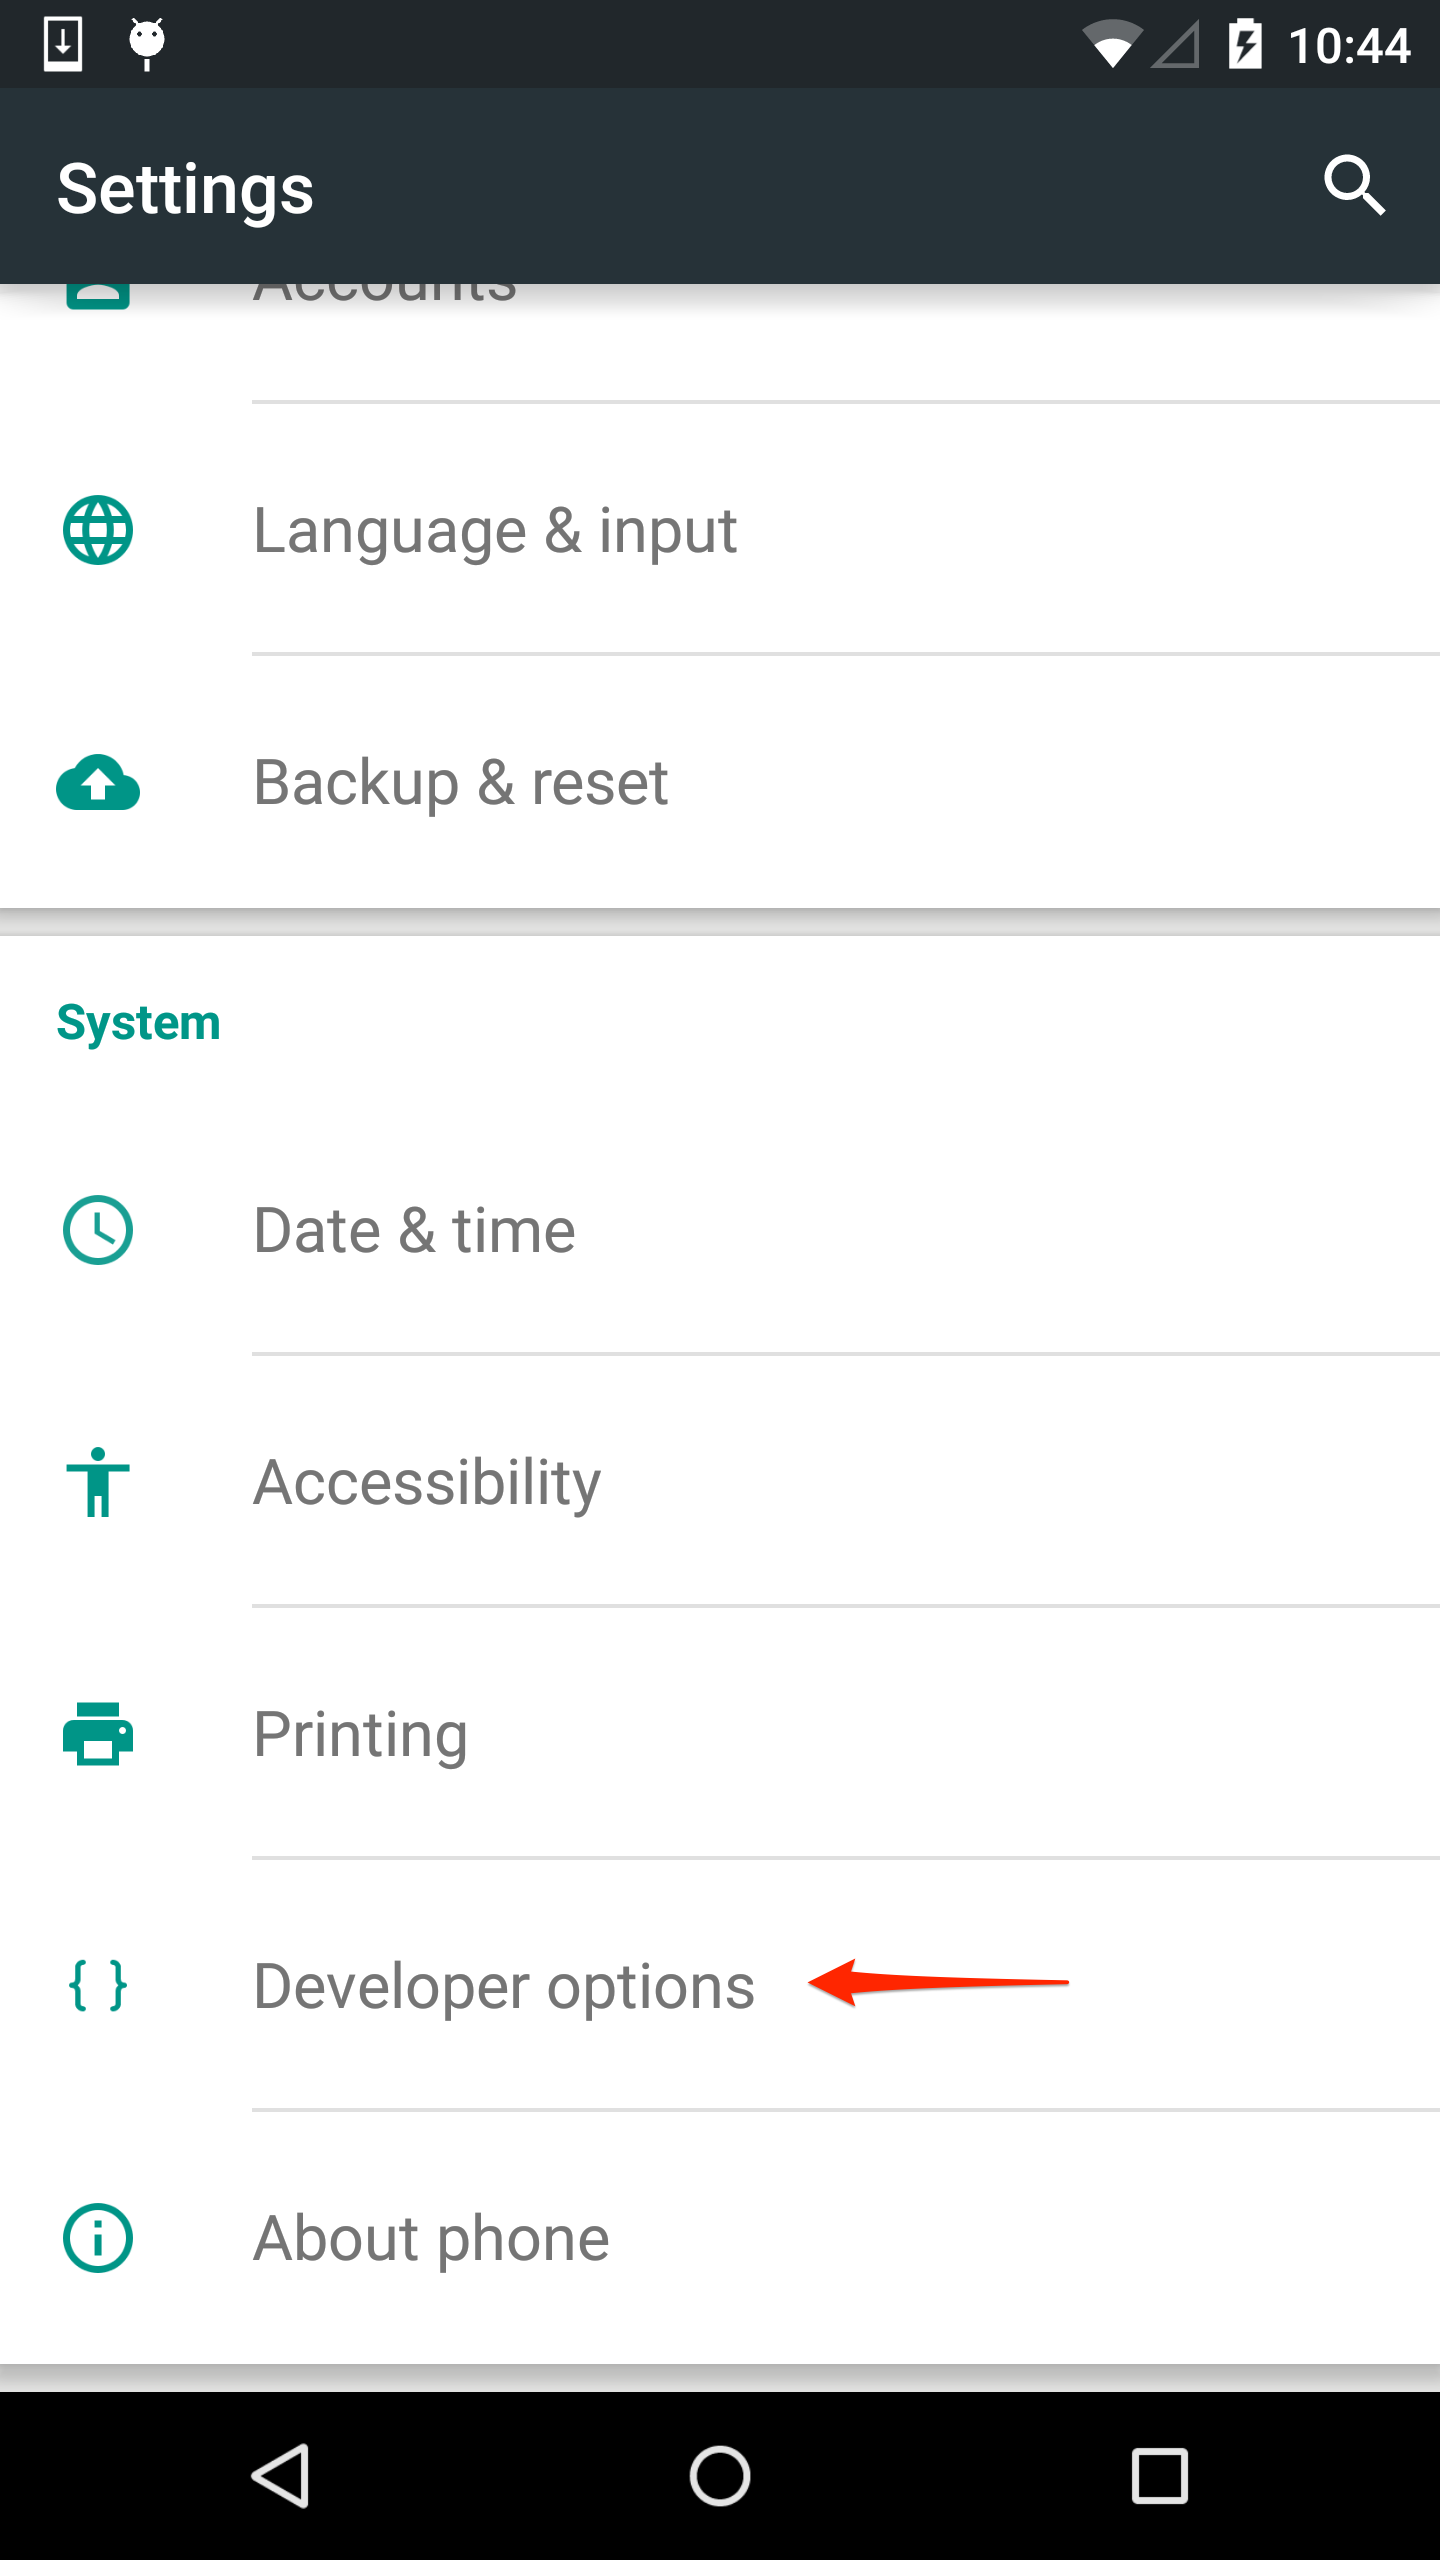
Go back to the previous Settings screen and locate the new developer options item:
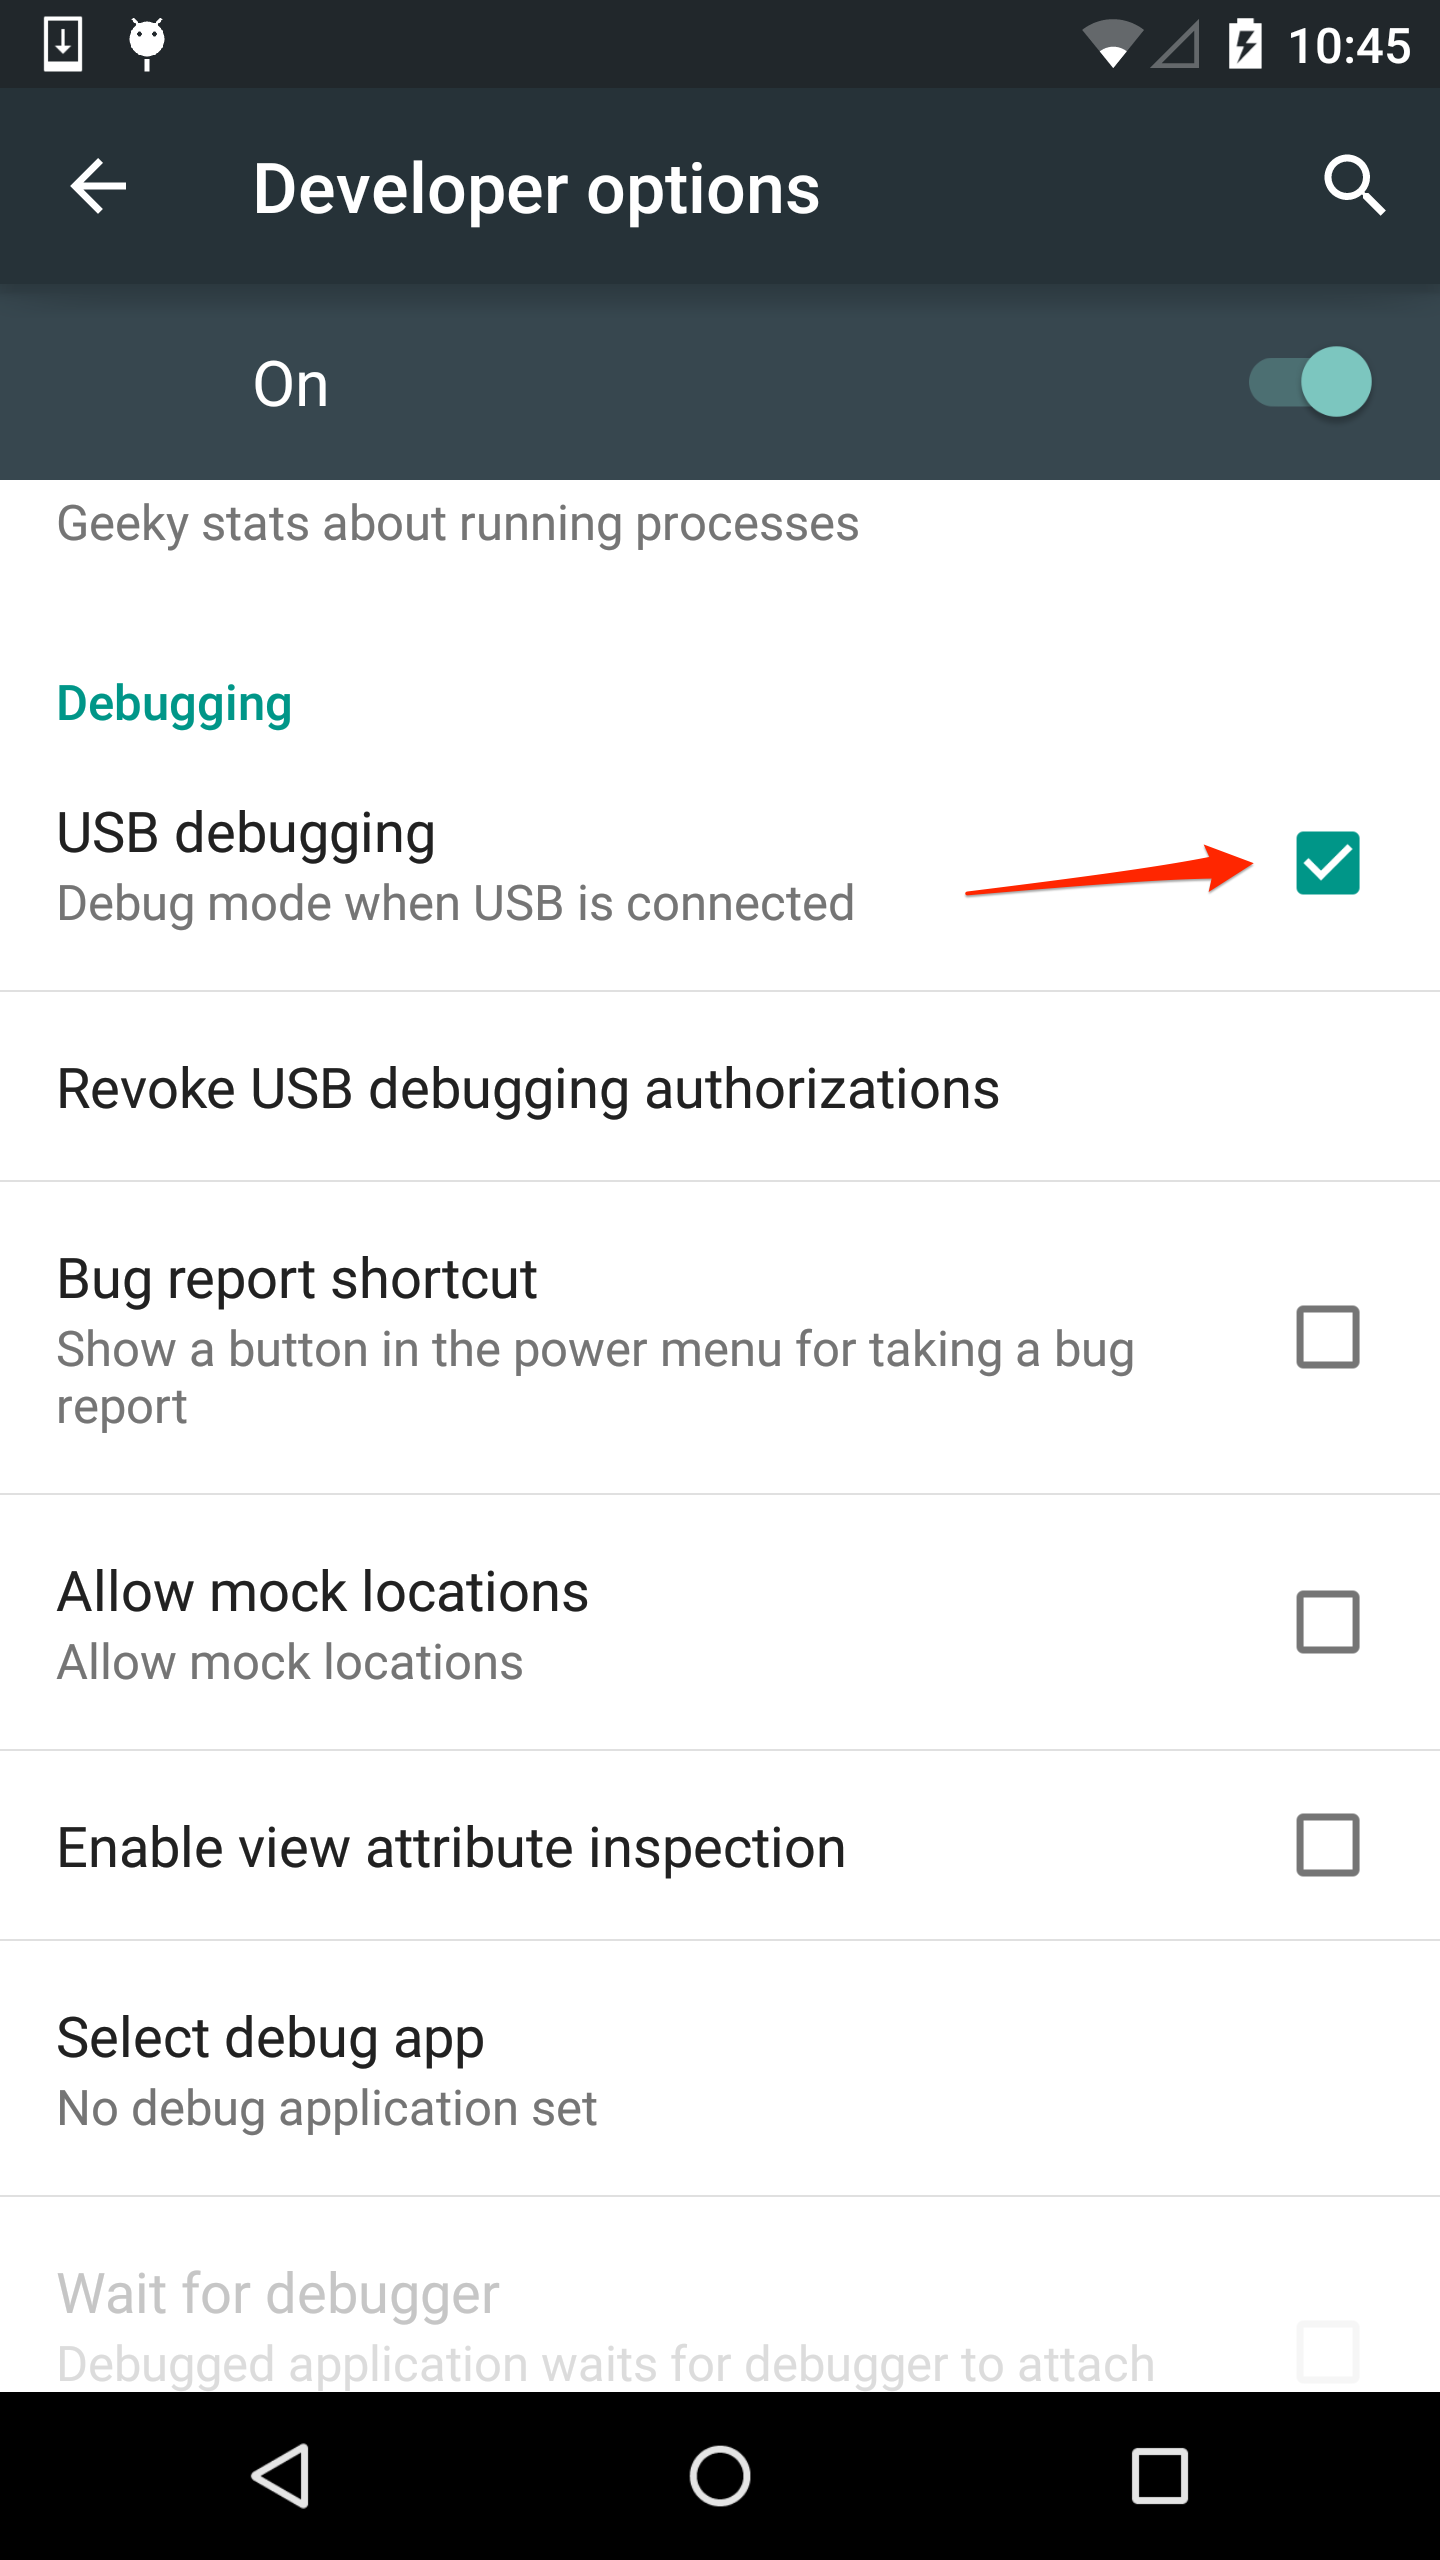
Tap into it and turn on USB Debugging (and any other settings you may need):
Run the mobile PhoneGap application you want to debug on the device from the CLI using $ phonegap run android
Open Chrome on your computer and type chrome://inspect/ for the URL location
From the Devices menu option on the left you should see your device with a list of web applications running on it including WebView applications. Locate your app in the list.
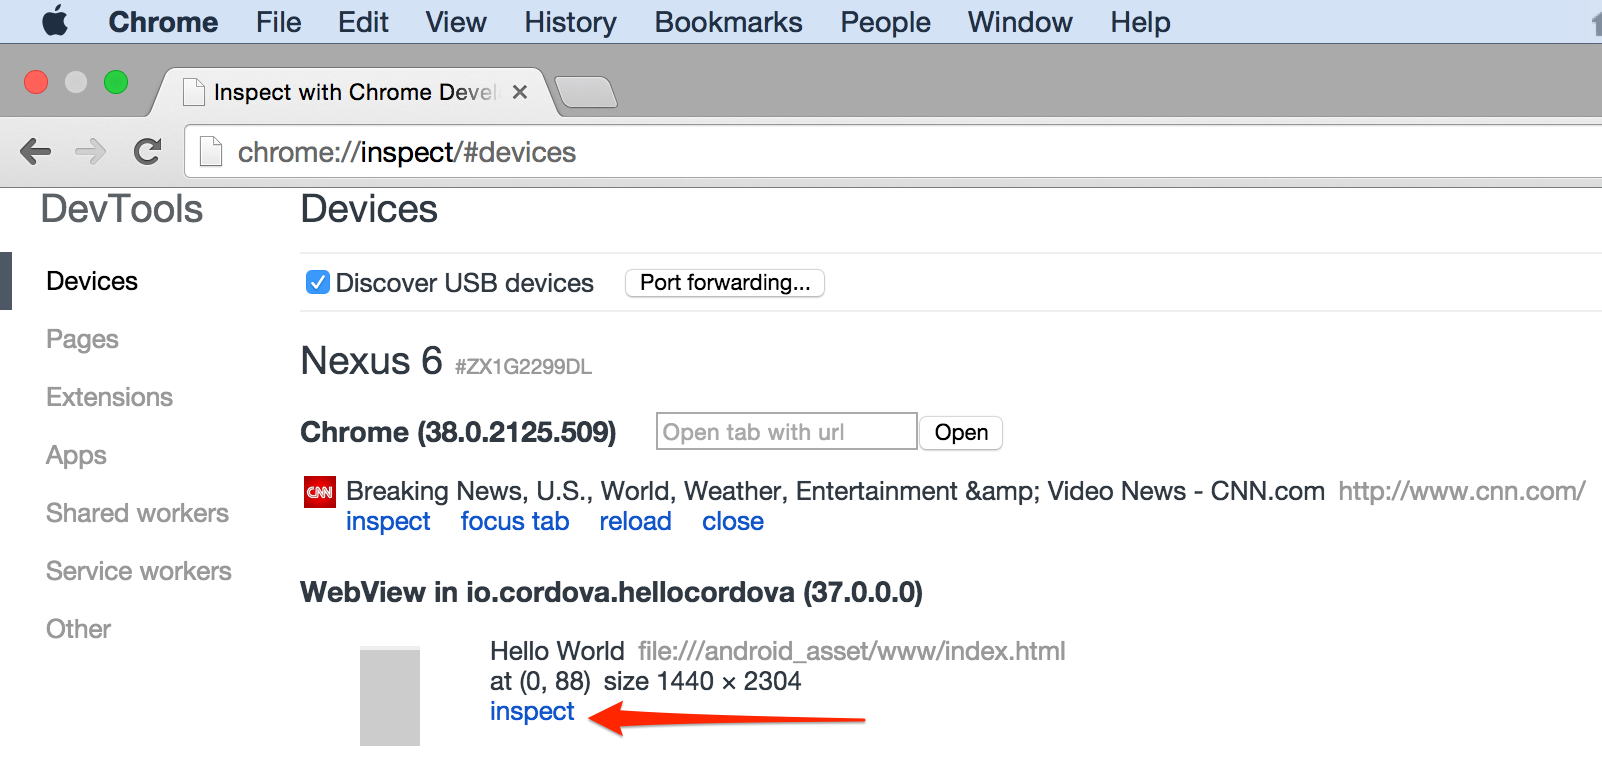
Click inspect and start debugging your application directly on your device using the Chrome DevTools.
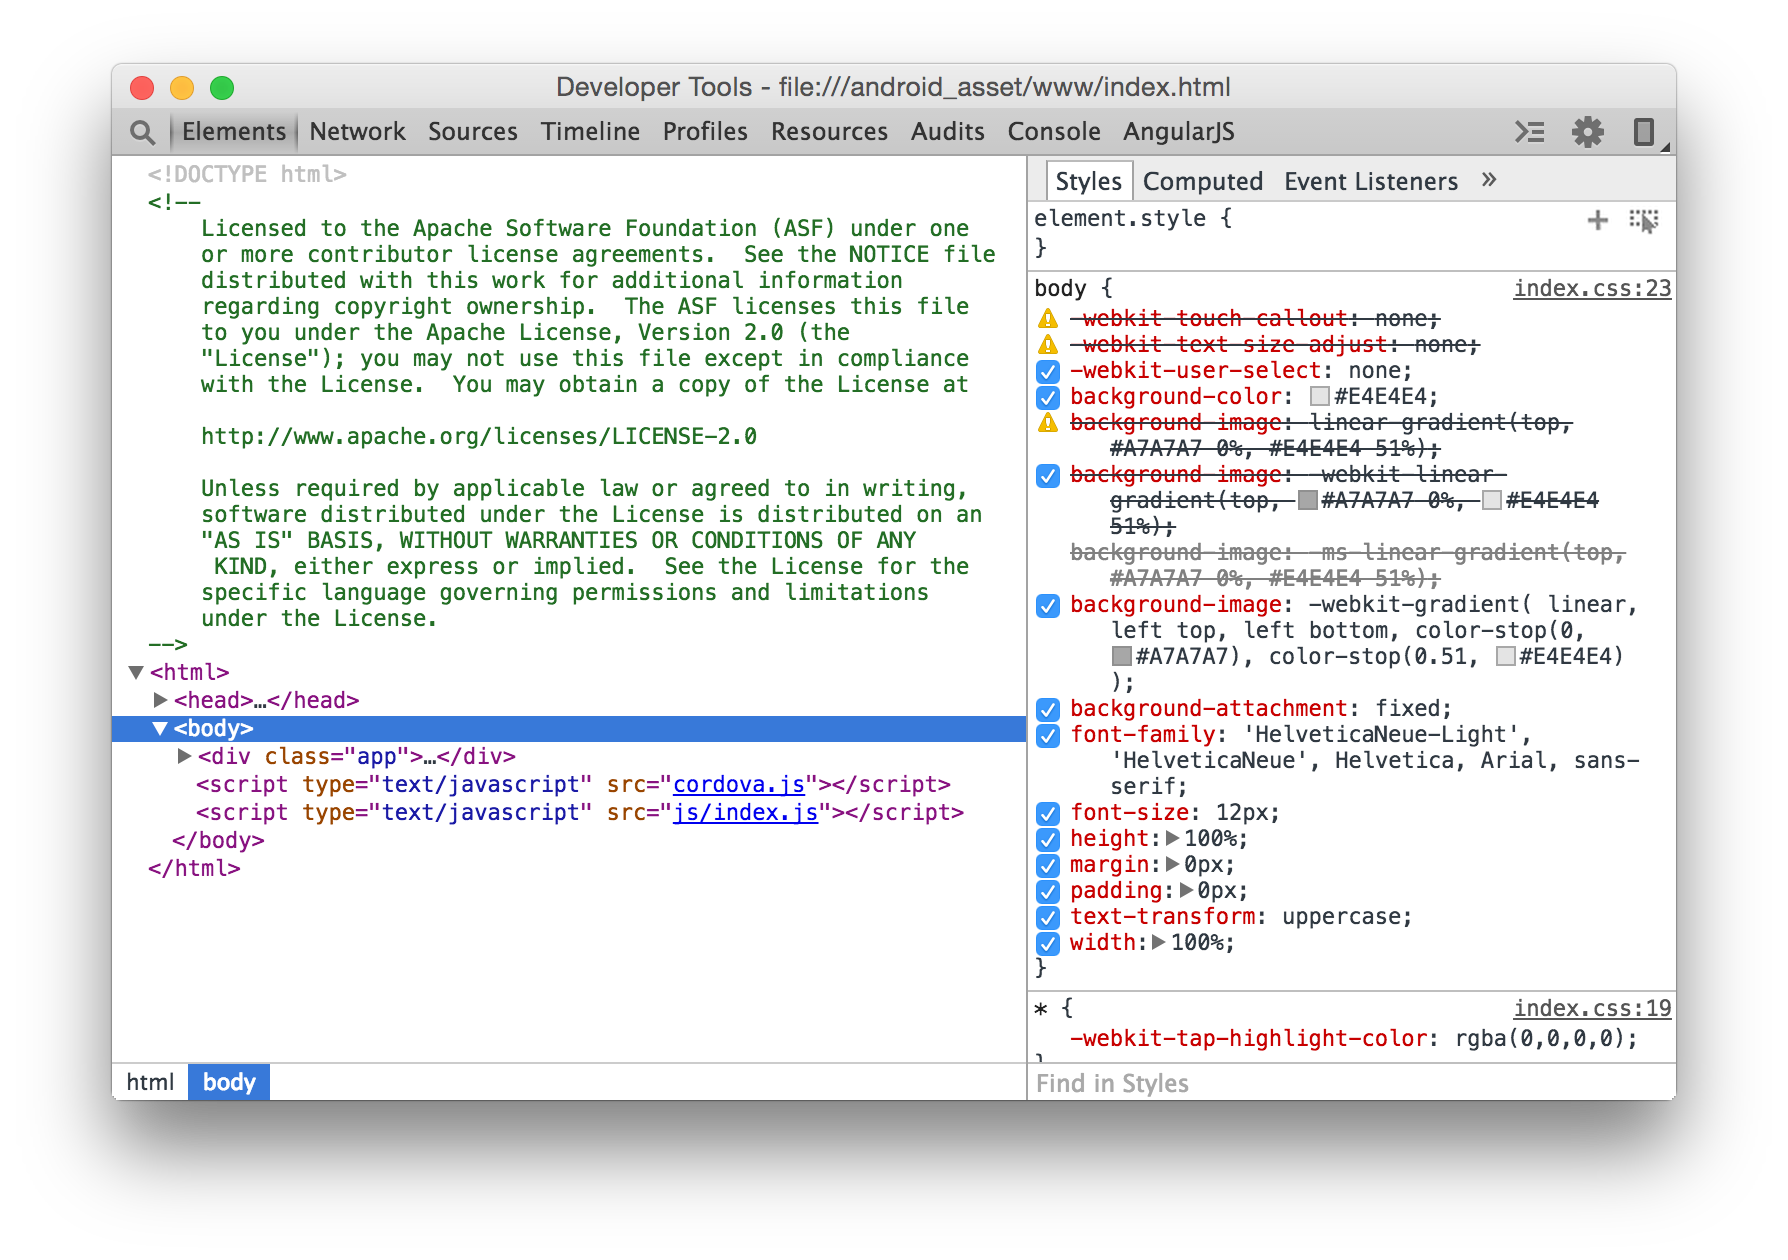
Check out the Chrome DevTools Official Documentation for details about what you can do with the tools.</div>
Currently you can use the Weinre remote inspection tool for debugging your apps running on the PhoneGap Developer App on your device. A guide on how to use this can be found [here in our PhoneGap Docs](http://docs.phonegap.com/references/developer-app/debugging/.